Introduction to near-infrared spectroscopy
Ever wondered how is it possible that different materials can be identified using infrared light? Well, this post is for you!
Materials and (near-)infrared light
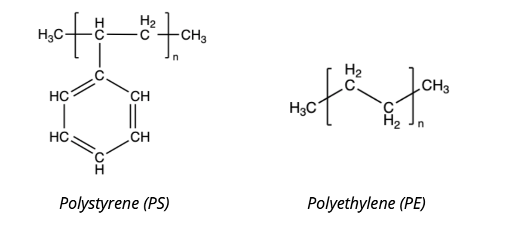
Most of the materials which can be analysed with our machine are polymers – such as polyethylene or cellulose (the main component of paper and cotton). These polymers consist of atoms arranged in long chains, typically containing atoms like carbon, hydrogen, oxygen, nitrogen and chlorine. Some chemical formulas of polymers are shown below – the square brackets with a little n is a scientific notation for “repeats many times”.
All the atoms vibrate – as if they were balls connected by springs. A typical hydrogen bonded to a carbon atom vibrates back and forth about 90 trillion times per second. This happens to be the about same frequency of vibration as that of infrared light waves. This makes the infrared light interact with the bonds between the various atoms and it is absorbed by the sample when the frequency of the atoms’ vibration matches the light’s frequency.
Well, this is nice but both PS and PE contain only hydrogen and carbon atoms so how can infrared light be used to distinguish between them?
It turns out that the chemical environment results in different bond vibration frequencies. Chemical environment means what other atoms are close to the bond and how the neighbouring atoms are bonded. For instance, in polystyrene, there are double carbon-carbon bonds while in polyethylene, there are only single carbon-carbon bonds – and this results in different interactions with infrared light for the two materials.
Measuring near-infrared spectra
In the previous section, we have described how samples (whether plastic or fabric) will absorb certain light waves if their frequency (and therefore the wavelength) matches the sample’s atoms’ vibrations.
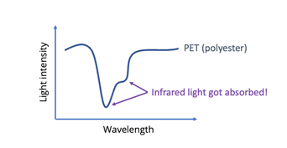
The diagram below shows how a sample would selectively absorb one wavelength of infrared light but let other wavelengths pass. This is then measured using our sensing system to find out which wavelength got absorbed.
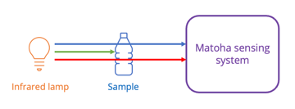
By plotting the amount of light passing through the sample as a function of wavelength, we’ll get a spectrum of the sample which serves as its unique fingerprint.
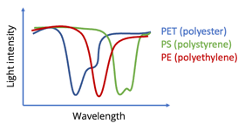
Different materials will have different spectra – and we use that to identify them!
Identifying materials
As you could see in the previous section, different materials have different spectra – so how can we go from a spectrum to the material identity?
Our special algorithms take the spectrum and compare it against all the spectra in the library inside the instrument. The closest matches are ranked on how well the library spectrum and the measured spectrum match (this can be seen as the “score” when performing measurements using our phone app).
If a close match is found, the instrument will show its identity on the screen and in our phone app.
What if there is no match? Our algorithms detect when the spectrum is too different from any of the spectra in the library – and the instrument will show “Unknown”.
Identifying blends (FabriTell-only)
Our FabriTell instruments have been specially modified to be able to measure the blends of the various fabrics. The algorithms behind this are a lot more complex than a simple library search – the reason for this is that the library to support all the blends would be huge and require a very, very large number of samples of varying composition.
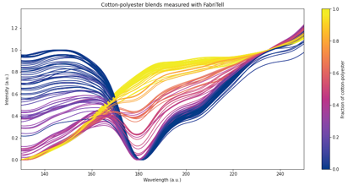
The spectra of the blends are essentially a combination of the spectra of the materials making up the blend. The graph below demonstrates this – yellow are pure cotton spectra while blue are pure polyester. The colours in between correspond to varying ratios of cotton and polyester.
Our highly sophisticated algorithms use this knowledge to extract the ratio of the two materials from the spectrum. Of course, this is only possible to a finite accuracy; sometimes, the blends just look too similar!
Hopefully, this article has shed some light on how our instruments work to help you use them in a more efficient way!